BioNMR
NMR aggregator & online community since 2003
BioNMR    
Learn or help to learn NMR - get free NMR books!
 

Go Back   BioNMR > NMR community > News from NMR blogs
Advanced Search
Home Forums Wiki NMR feeds Downloads Register Today's Posts


Jobs Groups Conferences Literature Pulse sequences Software forums Programs Sample preps Web resources BioNMR issues


Webservers
NMR processing:
MDD
NMR assignment:
Backbone:
Autoassign
MARS
UNIO Match
PINE
Side-chains:
UNIO ATNOS-Ascan
NOEs:
UNIO ATNOS-Candid
UNIO Candid
ASDP
Structure from NMR restraints:
Ab initio:
GeNMR
Cyana
XPLOR-NIH
ASDP
UNIO ATNOS-Candid
UNIO Candid
Fragment-based:
BMRB CS-Rosetta
Rosetta-NMR (Robetta)
Template-based:
GeNMR
I-TASSER
Refinement:
Amber
Structure from chemical shifts:
Fragment-based:
WeNMR CS-Rosetta
BMRB CS-Rosetta
Homology-based:
CS23D
Simshift
Torsion angles from chemical shifts:
Preditor
TALOS
Promega- Proline
Secondary structure from chemical shifts:
CSI (via RCI server)
TALOS
MICS caps, β-turns
d2D
PECAN
Flexibility from chemical shifts:
RCI
Interactions from chemical shifts:
HADDOCK
Chemical shifts re-referencing:
Shiftcor
UNIO Shiftinspector
LACS
CheckShift
RefDB
NMR model quality:
NOEs, other restraints:
PROSESS
PSVS
RPF scores
iCing
Chemical shifts:
PROSESS
CheShift2
Vasco
iCing
RDCs:
DC
Anisofit
Pseudocontact shifts:
Anisofit
Protein geomtery:
Resolution-by-Proxy
PROSESS
What-If
iCing
PSVS
MolProbity
SAVES2 or SAVES4
Vadar
Prosa
ProQ
MetaMQAPII
PSQS
Eval123D
STAN
Ramachandran Plot
Rampage
ERRAT
Verify_3D
Harmony
Quality Control Check
NMR spectrum prediction:
FANDAS
MestReS
V-NMR
Flexibility from structure:
Backbone S2
Methyl S2
B-factor
Molecular dynamics:
Gromacs
Amber
Antechamber
Chemical shifts prediction:
From structure:
Shiftx2
Sparta+
Camshift
CH3shift- Methyl
ArShift- Aromatic
ShiftS
Proshift
PPM
CheShift-2- Cα
From sequence:
Shifty
Camcoil
Poulsen_rc_CS
Disordered proteins:
MAXOCC
Format conversion & validation:
CCPN
From NMR-STAR 3.1
Validate NMR-STAR 3.1
NMR sample preparation:
Protein disorder:
DisMeta
Protein solubility:
camLILA
ccSOL
Camfold
camGroEL
Zyggregator
Isotope labeling:
UPLABEL
Solid-state NMR:
sedNMR


Reply
Thread Tools Search this Thread Rate Thread Display Modes
  #1  
Unread 12-28-2013, 07:05 PM
nmrlearner's Avatar
Senior Member
 
Join Date: Jan 2005
Posts: 23,175
Points: 193,617, Level: 100
Points: 193,617, Level: 100 Points: 193,617, Level: 100 Points: 193,617, Level: 100
Level up: 0%, 0 Points needed
Level up: 0% Level up: 0% Level up: 0%
Activity: 50.7%
Activity: 50.7% Activity: 50.7% Activity: 50.7%
Last Achievements
Award-Showcase
NMR Credits: 0
NMR Points: 193,617
Downloads: 0
Uploads: 0
Default Smaller NMR files

Smaller NMR files

Background

One important issue we had noticed with Mnova NMR files is that they can be quite large, particularly when a document contains several 2D spectra. At first sight, file size should not be a big concern, especially considering the large storage capabilities available today, either locally (i.e. hard disks with sizes in the order of Terabytes) or in the cloud (Dropbox, Google Drive, Skydrive, etc).
On the other hand, the tremendous advancements on both technological and methodological fronts have made possible the acquisition of enormous volumes of data. For example, IBM has estimated that 2.5 quintibillion bytes of data are being generated each day, with more than 90 per cent of which created in the last two years. Whilst it is difficult to scale this level of information into analytical data (i.e. NMR spectra), it is quite likely that they also follow a similar growth.
At Mestrelab we have devoted major efforts to the development of new technologies which would allow Mnova to reduce the size of NMR spectra while preserving their informational content. This will be elaborated in the following section.

Lossless and lossy compression

Roughly speaking, there are two two different classes of compression methods: lossless and lossy.


Lossless techniques allow the data to be compressed, then decompressed back to its original state without any loss of data. Well-known algorithms for this type of compression are Zip and Rar methods. Compression rates for lossless techniques vary but are typically around 2:1 to 3:1, e.g in medical images. In the particular case of high resolution NMR spectra, there re some relevant characteristics that diminish the performance of this type of algorithms.NMR spectra consist mostly of a noisy background and hence appear as essentially random numbers to the algorithm which makes lossless compression rather ineffective; in general, NMR spectra can be compressed by no more than 10-30% (on average) using lossless compression schemes.


Lossy techniques do not allow the exact recovery of the original data once it has been compressed, but this loss of information can be modulated in such a way that it can be virtually negligible. In the particular case of NMR, we have applied several advanced compression techniques [1, 2] which afford extraordinarily high compression rates while preserving all the spectral information. In some cases, compression rates in the order of 800:1 can be achieved, although for practical uses and in order to avoid any potential loss of information, more moderate rates are recommended.


An example

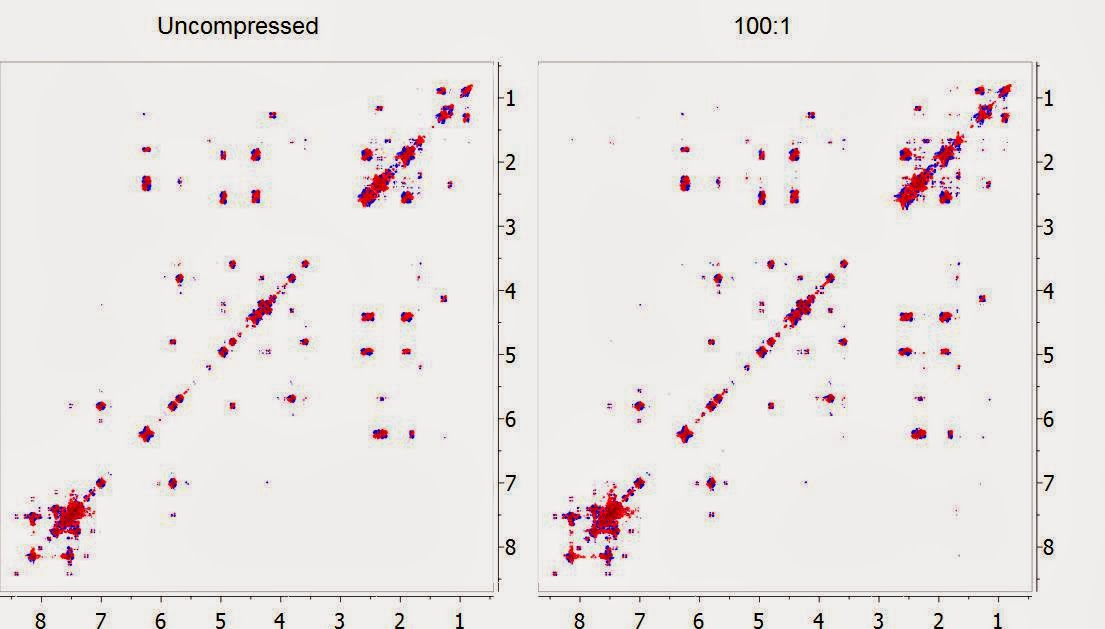
In the figure below, the DQF-COSY of Taxol (Paclitaxel) is shown at its original uncompressed format (left) and after being compressed 100 times with the new built-in compression algorithm in Mnova and decompressed back (right). Both spectra have been displayed with the same contour levels. Can you spot the differences?


Whilst we have done lots of numerical tests to make sure that at this high level of compression all the spectral information is preserved (see [1] and [2] for more details), a simple yet intuitive way to visualize whether the compression has been effective is by subtracting the uncompressed spectrum with the compressed counterpart. In this example, this is the residual spectrum:


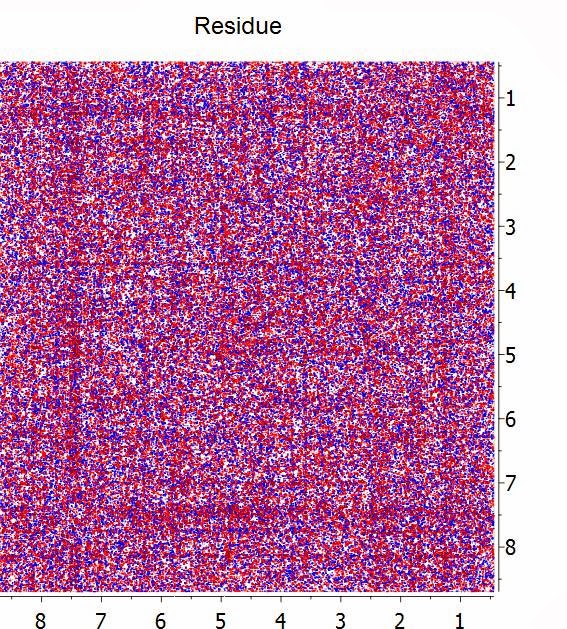
Basically, all that it remains is noise and no structures (cross peaks) are visible on the residual.
A practical guide with Mnova 9.0

This is how compression works in Mnova NMR. First, all the compression options are available in the global Preferences of the software (command Edit / Preferences), in the NMR/Save page (see below):


At this point, there are two different compression mechanisms:


FID compression: The FID is the most important component of an NMR spectra where all the actual recorded information is stored. We don’t want to miss even a single bit of this data and hence, the FID is only compressed using a lossless algorithm. Of course, the compression ratio will be much more modest, but it is critical to preserve all this information.


FT spectrum Compression: This is where the lossy compression algorithm can be applied, in the frequency domain spectrum. Actually, it is also possible to use a lossless algorithm but in order to achieve high compression ratios, the lossy method should be selected. Whilst values of 100:1 or even higher should give good results, it would be more sensible to use more moderate values, in the range of 10:1 – 20:1.


Final notes

The fact that Mnova NMR documents keep both the original recorded FID (which can optionally be compressed using the lossless technique) as well as the processed NMR spectrum (which can optionally be compressed using the lossy technique) explains why the resulting compressed document is not as small as one could expect after having compressed the data with high compression ratios. The FID might contribute significantly to the final file size. Of course, the differences will be more appreciated in 2D NMR spectra processed with Zero Filling or Linear Prediction so that the final data matrix becomes significantly larger than the time domain vectors.


On the other hand and considering again the point that Mnova always keeps a copy of the original FID, why we don’t just save this FID plus the processing commands required to reconstruct the processed spectrum as other NMR applications do? Actually, this is a nice approach (under some circumstances) and would yield the best compression ratio achievable. Unfortunately, this does not work well for many applications and introduce some additional difficulties. Just to give a simple example: You have processed a 2D spectrum which was acquired with a NUS scheme and you have applied some additional time-consuming analysis operations (i.e. 2D-GSD based peak picking). In this particular case, opening this single spectrum would take several seconds (if not minutes). Having the ability to access directly to the processed spectrum without the need to reprocess it may be very handy.


References:

[1] Carlos Cobas, Pablo G. Tahoces, Manuel Martin-Pastor, Mónica Penedo, F. Javier Sardina (2004), Wavelet-based ultra-high compression of multidimensional NMR data sets, J. Magn. Reson. 168: Pages 288–295.
DOI: http://dx.doi.org/10.1016/j.jmr.2004.03.016

[2] C. Cobas, P. G. Tahoces, I. Iglesias Fernández (2008), Compression of high resolution 1D and 2D NMR data sets using JPEG2000, Chemometrics and Intelligent Laboratory Systems, 91, 141-150
DOI:: http://dx.doi.org/10.1016/j.chemolab.2007.10.009


More...

Source: NMR-analysis blog
Reply With Quote


Did you find this post helpful? Yes | No

Reply
Similar Threads
Thread Thread Starter Forum Replies Last Post
[NMR paper] Solution NMR analyses of the C-type carbohydrate recognition domain of DC-SIGNR reveal different binding modes for HIV-derived oligosaccharides and smaller glycan fragments.
Solution NMR analyses of the C-type carbohydrate recognition domain of DC-SIGNR reveal different binding modes for HIV-derived oligosaccharides and smaller glycan fragments. Related Articles Solution NMR analyses of the C-type carbohydrate recognition domain of DC-SIGNR reveal different binding modes for HIV-derived oligosaccharides and smaller glycan fragments. J Biol Chem. 2013 Jun 20; Authors: Probert F, Whittaker SB, Crispin M, Mitchell DA, Dixon AM Abstract The C-type lectin DC-SIGNR (Dendritic Cell-Specific ICAM-3-Grabbing...
nmrlearner Journal club 0 06-25-2013 12:17 AM
[Question from NMRWiki Q&A forum] How to open multiple pdb files with PyMol - all at once?
How to open multiple pdb files with PyMol - all at once? Hello, I've started using PyMol for looking at the bundles of NMR structures. You can open files one-by-one, but it's kind of tedious... Is there a trick? Thanks! Check if somebody has answered this question on NMRWiki QA forum
nmrlearner News from other NMR forums 0 04-05-2013 11:03 PM
[NMR images] files.chem.vt.edu
http://www.files.chem.vt.edu/chem-ed/spec/spin/graphics/nmr-levels.gif http://www.files.chem.vt.edu/chem-ed/spec/spin/nmr.html 15/07/2012 4:27:21 AM GMT files.chem.vt.edu More...
nmrlearner NMR pictures 0 08-12-2012 04:02 PM
[NMR Sparky Yahoo group] Re: basic problem with installation and conversion files
Re: basic problem with installation and conversion files Rino, The bruk2ucsf files, etc. are in the ~/Sparky/Contents/Resources/bin/ which you can get to by right clicking on the Sparky icon, and selecting "Show More...
nmrlearner News from other NMR forums 0 06-04-2012 04:54 PM
[CNS Yahoo group] problem running test files in CNS 1.3
problem running test files in CNS 1.3 Hello, I installed CNS 1.3 on linux (intel i686) and used the testfiles. Up to this everything worked fine but when I tried to compare the output files with More...
nmrlearner News from other NMR forums 0 11-09-2011 06:44 AM
[CNS Yahoo group] problem running test files in CNS 1.3
problem running test files in CNS 1.3 Hello, I installed CNS 1.3 on linux (intel i686) and used the testfiles. Up to this everything worked fine but when I tried to compare the output files with More...
nmrlearner News from other NMR forums 0 10-10-2011 06:30 PM
[Question from NMRWiki Q&A forum] How would you compare solving NMR structure of a smaller peptide vs that of globular protein?
How would you compare solving NMR structure of a smaller peptide vs that of globular protein? By smaller peptide I mean somewhere around 15-20 aminoacids, having a cycle or two that constrain the geometry. Also - I am interested in getting as much detail about the structure of the peptide as possible. Do you typically need to record NOE buildup curves in such cases? Given that side-chains of the peptide are unlikely to be packed like in the core of the globular protein - do you include side-chain NOE's into structure calculations?
nmrlearner News from other NMR forums 0 03-17-2011 06:30 PM
[NMR tweet] NUCLEAR MAGNETIC RESONANCE SPECTROSCOPY USING LIGHT WITH ORBITAL ANGULAR MOMENTUM - uses much smaller magnets http://goo.gl/bViWh
NUCLEAR MAGNETIC RESONANCE SPECTROSCOPY USING LIGHT WITH ORBITAL ANGULAR MOMENTUM - uses much smaller magnets http://goo.gl/bViWh Published by BillStarnaud (Bill St. Arnaud) on 2011-01-05T15:10:18Z Source: Twitter
nmrlearner Twitter NMR 0 01-05-2011 03:28 PM


Posting Rules
You may not post new threads
You may not post replies
You may not post attachments
You may not edit your posts

BB code is On
Smilies are On
[IMG] code is On
HTML code is Off
Trackbacks are Off
Pingbacks are Off
Refbacks are Off


BioNMR advertisements to pay for website hosting and domain registration. Nobody does it for us.


Powered by vBulletin® Version 3.7.3
Copyright ©2000 - 2024, Jelsoft Enterprises Ltd.
Copyright, BioNMR.com, 2003-2013
Search Engine Friendly URLs by vBSEO 3.6.0

All times are GMT. The time now is 01:16 PM.


Map