Bell Bell
Our friends working in the field of biopolymers can study a single molecules for months and can afford to spend a lot of time with their NMR spectra, if the time invested translates into higher accuracy of their results.
Software makers are more interested in creating automatic tools that work without human intervention, day and night, because of the higher appeal of any push-button solution. Is anybody helping our friends? Yes! One month ago a simple and effective tool appeared for measuring the volume of a 2-D cross peak, courtesy of
iNMR. Let's see, with a practical example, what it does and how it works.

We start from the normal contour map. Here you click on a single peak and optionally enter two labels to assign it. In the picture we have selected the peak at the bottom right. Many things automatically happen, if you like: the program can locate the maximum of the peak and fit the overall shape with a gaussian bell. Why a Gaussian instead of a Lorentzian? As you know, 2-D spectra are premultiplied with cosine bells before the FT, and the purpose of this weight is just to transform the shape. The tails of the gaussian are much shorter, so we avoid the lorentzian as far as possible. The additional problem, in this particular case and in many other cases, is the presence of unresolved J-couplings. When they are resolved, you can fit the peak with a combination (sum) of bells. In our case, we could try to fit the peak with a doublet, but for simplicity we'll approximate it to a singlet.
My pictures do not show the moving cross-sections around the border of the contour plot. The cross-sections, that exist into the program, give a graphic idea of the goodness of the fit. Up to now, cross-sections included, there is nothing new. Everything has been copied from more ancient programs (read: Sparky). But now, a single click brings us into the Manual Fitting module, which is the novelty.

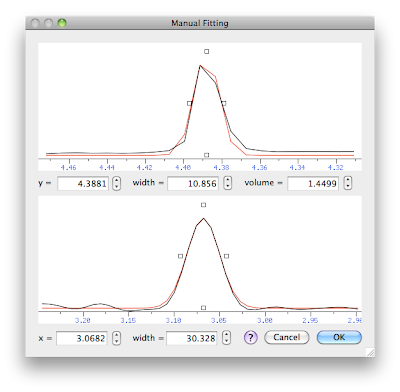
We have two orthogonal cross-sections: the yz section at the top and the xz section at the bottom. The experimental spectrum is black, the model (gaussian curve) is red. We can change the 5 parameters that describe the model. The simpler way to change them is by dragging the little square handles. Alternatively, we have the numerical fields or the little arrows. When you change the x frequency in the lower panel, the programs show a different vertical cross-section in the upper panel, corresponding to the new x. When you change the y frequency in the upper panel, a different horizontal section is selected.
The final picture shows my best result, that is the way I would measure the volume of this particular peak. Higher accuracy can likely be obtained with a model comprising two gaussians (something you can also do with this module), yet the present result is accurate enough for many practical applications.
All the values are automatically stored into a bigger module called "Cross Peaks Manager" (CPM in the following; actually you need to create a CPM before starting any volume-fitting operation). The CPM stores things of different kinds: chemical shifts, assignments, integrated volumes, fitted volumes, etc. A real-life problem where a CPM can be precious is the measure of relaxation times of very large molecules, like proteins. These molecules are so large that very few signals are resolved in the 1-D proton spectrum, while the sensitivity of other nuclei is not enough. You collect a series of HSQC spectra, a 2-D experiment that resolves all the signals (or almost all of them). A single CPM can manage the whole series of experiment. When you have processed all of them, you can ask the CPM to create a table with the integrals. The table combines volumes measured by integration and volumes measured by fitting (manual or automatic). You are not confined to a single solution. You are free to integrate each single peak with the most appropriate technique for it. If this is not enough, you have the time-saving option of simultaneous automatic integration.

Source:
NMR Software blog


 Linear Mode

