Basis on qNMR: Integration Rudiments (Part I)
First a quick recap. In my
last post I put forward the idea that integration of NMR peaks is the basis of quantitative analysis. Before going any further, I would like to mention that, alternatively, peak heights can also be used for quantitation, but unless some special pre-processing is employed (see for example P. A. Haysa, R. A. Thompson,
Magn. Reson. Chem.,
2009, 47, 819 824,
doi) measurement of peak areas is generally the recommended method for qNMR assays.
In this post I will cover some very basic rudiments of NMR peak areas measurements, without going into depth into complicated math , as my objective is just to set the basis for oncoming, more advanced posts.
NMR Integration basic Rudiments
Peak areas may be determined in various ways. While I was still at school I learnt a very simple peak area calculation method which just required a good analytical balance and scissors. This was the so-called cut & weigh method and is illustrated in the figure below.

By simply cutting out a rectangle of known value, for example, known ppm or Hz on x-axis and known intensities on the y-axis, a calibration standard is obtained (in this case, 8 units of area). After cutting and weighing this standard, the area of any peak can be determined by cutting and weighing the peak(s) from the chart, weighing the paper and using this equation:
Area of Peak(s) = Area of standard * Weight of peak / Weight of standard
Yet, despite its primitiveness, this technique was remarkably precise for the purpose for which it was intended (obviously, not for accurate NMR peak areas measurement :-) ) but, of course, it assumed that the density of the paper was homogenous.
There are other classical methods such as counting squares,
planimeters or mechanical integrators but in general they were subject to large errors. In the analogic era, it was more convenient to measure the integral as a function of time, using an electronic integrator to sum the output voltage of the detector over the time of passage through the signals. In those old days, as described in [2], before the FT NMR epoch, the plotter was set to integral mode and the pen was swept through the peak or group of peaks as the pen level rose with the integrated intensity.
Enough about archaic methods, we are in the 21st century now and all NMR spectra are digitalized, processed and analyzed by computers. As Richard Ernst wrote once [1],
Without Computers no modern NMR. How are NMR integrals measured? From a user point of view, its very straightforward: the user selects the left and right limits of the peaks to be integrated and the software reports the area (most NMR software packages have automated routines to automatically select the spectral segments to be integrated). For example, the figure below shows how this is done with our NMR software,
Mnova.
 Integration: Whats under the hood
But the question is: how is the computer actually calculating NMR peak areas? In order to answer this, lets revisit some very simple integration concepts.
From basic calculus we all learnt in school, we know that in order to compute the area of a function (e.g. f(x)) we simply need to calculate the integral of that function over a given interval (e.g. [a,b]).

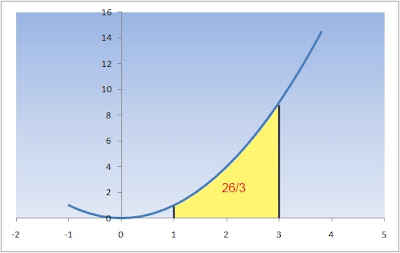
If the function to be integrated (integrand) f(x) is known, we can analytically calculate the value of the area. For example, if the function has the simple quadratic expression

and we want to calculate the area under the curve over the interval [1,3], we just need to apply the well known Fundamental Theorem of Calculus so that the resulting area will be:

Unfortunately, real life is always more complex. Where NMR is concerned, function f(x) is, in general, not known so it cannot be integrated as done before using the Calculus fundamental theorem. I wrote in general because theory tells us the analytical expression for an NMR signal (i.e. we know that, at a good approximation, NMR signals can be modeled as Lorentzian functions) but, for the moment, lets consider the more general case in which the NMR signal has an unknown lineshape.
Furthermore, up until now we have assumed that f(x) is a continuous function. Obviously, this is not the case for computer generated NMR signals as they are discrete points as a result of the analog to digital conversion. Basically, the digitizer in the spectrometer samples the FID voltage, usually at regular time intervals and assigns a number to the intensity. As a result, a tabulated list of numbers is stored in the computer. This is the so-called FID which, after a discrete Fourier Transform yields the frequency domain spectrum. So how can a tabular set of data points (the discrete spectrum) can be integrated?
A very naive method (yet as we will see shortly, very efficient) is to use very simple approximations for the area: Basically the integral is approximated by dividing the area into thin vertical blocks, as shown in the image below.


This method is called the
Riemann Integral after its inventor,
Bernhard Riemann.
Intuitively we can observe that the approximation gets better if we increase the number of rectangles (more on this in a moment). In practice, the number of rectangles is defined by the number of discrete points (digital resolution) in such a way that every point in the region of the spectrum to be integrated defines a rectangle.
For example, lets consider the NMR peak shown in the figure below which I simulated using the spin simulation module of Mnova. It consists of a single Lorentzian peak with a line width at half height of 0.8531 points and a height of 100. With all this information we can know in advance the expected exact area calculated as follows:

In the spectrum shown in the image below we can see the individual digital points as crosses and the continuous trace which have been constructed by connecting the crosses by straight lines (usually only these lines are shown in most NMR software packages. The capability of showing both the discrete points and the continuous curve is a special feature of
Mnova.
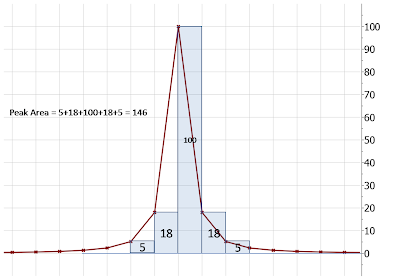
If the simple Riemann method is applied, we obtain an area = 146, which represents an error of ca 21% with respect to the true area value (184.12). Its worth mentioning that the true value is calculated by integrating the function from minus infinite to plus infinite whilst in the example above the integration interval is very narrow.
As mentioned above, the approximate area should get better if we increase the number of rectangles. This is very easy to achieve if we use some kind of interpolation to, for example, double the number of discrete points. We could use some basic linear interpolation directly in the frequency domain, although in NMR we know that a better approach is to extend the FID with zeroes via the so-called zero filling operation.
So if we double the number of digital points and thus the number of rectangles used for the area calculation we obtain a value of 258 (see image below). In this case, as the digital resolution is higher, the line width at half height is also higher, 1.7146 (in other words, we have more digital points per peak) so the true integral value will be 269.32:


Now the error we are committing is just as little as 4%. As a general rule it can be said that the better the digital resolution, the better the integration accuracy.
Mathematically, Riemann method can be formulated as:

Considering that in almost all NMR experiments, we are interested in relative areas, the spacing between data points,
?x , is a common factor and can be dropped from the formulas with no loss of generality.

This is exactly the method of choice of most NMR software packages for peak area calculations: NMR integrals are calculated by determining the running sum of all points in the integration segment.
Other numeric integration methods
One important conclusion from the previous section is that in order to get more accurate areas we should increase the number of integration rectangles, something which is equivalent to increasing the number of digital points (e.g. by acquiring more points or using zero filling).
Instead of using the running sum of the simple individual rectangles, we can use some kind of polynomial interpolation between the limits defining each rectangle. The simplest method uses linear interpolation so that instead of rectangles we use trapezoids. This is the well known trapezoid rule which is formulated as:

If instead of linear interpolation we use parabolic interpolation, the method receives the name of Simpson as its formulated as [3]:

It is limited to situations where there are an even number of segments and thus, odd number of points. These 3 methods are summarized graphically in the figure below.

Other more sophisticated methods such as Romberg, Gaussian quadrature, etc, are beyond the scope of this post and
can be found elsewhere.
Which integration method is more suitable for NMR?
This question will remain unanswered for now, open for discussion. Of the 3 integration methods discussed in this post, at first glance Simpson should be the most accurate. However, as explained in [3], this method is more sensitive to the integral limits (e.g. left and right boundaries) in such a way that if the limits are shifted one point to the left or to the right, the integral value will change significantly, while the other two approaches are more robust and the values are less affected.
In my experience, the difference between the simple sum and trapezoid method is small compared to other sources of errors (e.g. systematic and random errors, to be discussed in my next post) so using one approach or the other should not make any relevant difference.
Naturally, if very precise integral values are required, then more advanced methods based on deconvolution should be used. Of course, if you have any input, youre more than welcome to leave your comments here.
Conclusions
There's a great deal more to NMR Integrals than reviewed here: I have simply scratched the surface. In my next post, I will follow up with the limits and drawbacks of standard NMR integration, introducing better approaches such as Line Fitting or Deconvolution.
References
[1] Ernst Richard R., Without computers - no modern NMR, in Computational Aspects of the Study of Biological Macromolecules by Nuclear Magnetic Resonance Spectroscopy, Edited by J.C.Hoch et al. Plenum Press 1991, pages 1-25
[2] Neil E. Jacobsen, NMR Spectroscopy Explained: Simplified Theory, Applications and Examples for Organic Chemistry and Structural Biology, N.J. : Wiley-Interscience, 2007
[3] Jeffrey C. Hoch and Alan S. Stern, NMR Data Processing, Wiley-Liss, New York (1996)
 More...
Source:
NMR-analysis blog


 Linear Mode

