BioNMR
NMR aggregator & online community since 2003
BioNMR    
Learn or help to learn NMR - get free NMR books!
 

Go Back   BioNMR > NMR community > News from NMR blogs
Advanced Search
Home Forums Wiki NMR feeds Downloads Register Today's Posts


Jobs Groups Conferences Literature Pulse sequences Software forums Programs Sample preps Web resources BioNMR issues


Webservers
NMR processing:
MDD
NMR assignment:
Backbone:
Autoassign
MARS
UNIO Match
PINE
Side-chains:
UNIO ATNOS-Ascan
NOEs:
UNIO ATNOS-Candid
UNIO Candid
ASDP
Structure from NMR restraints:
Ab initio:
GeNMR
Cyana
XPLOR-NIH
ASDP
UNIO ATNOS-Candid
UNIO Candid
Fragment-based:
BMRB CS-Rosetta
Rosetta-NMR (Robetta)
Template-based:
GeNMR
I-TASSER
Refinement:
Amber
Structure from chemical shifts:
Fragment-based:
WeNMR CS-Rosetta
BMRB CS-Rosetta
Homology-based:
CS23D
Simshift
Torsion angles from chemical shifts:
Preditor
TALOS
Promega- Proline
Secondary structure from chemical shifts:
CSI (via RCI server)
TALOS
MICS caps, β-turns
d2D
PECAN
Flexibility from chemical shifts:
RCI
Interactions from chemical shifts:
HADDOCK
Chemical shifts re-referencing:
Shiftcor
UNIO Shiftinspector
LACS
CheckShift
RefDB
NMR model quality:
NOEs, other restraints:
PROSESS
PSVS
RPF scores
iCing
Chemical shifts:
PROSESS
CheShift2
Vasco
iCing
RDCs:
DC
Anisofit
Pseudocontact shifts:
Anisofit
Protein geomtery:
Resolution-by-Proxy
PROSESS
What-If
iCing
PSVS
MolProbity
SAVES2 or SAVES4
Vadar
Prosa
ProQ
MetaMQAPII
PSQS
Eval123D
STAN
Ramachandran Plot
Rampage
ERRAT
Verify_3D
Harmony
Quality Control Check
NMR spectrum prediction:
FANDAS
MestReS
V-NMR
Flexibility from structure:
Backbone S2
Methyl S2
B-factor
Molecular dynamics:
Gromacs
Amber
Antechamber
Chemical shifts prediction:
From structure:
Shiftx2
Sparta+
Camshift
CH3shift- Methyl
ArShift- Aromatic
ShiftS
Proshift
PPM
CheShift-2- Cα
From sequence:
Shifty
Camcoil
Poulsen_rc_CS
Disordered proteins:
MAXOCC
Format conversion & validation:
CCPN
From NMR-STAR 3.1
Validate NMR-STAR 3.1
NMR sample preparation:
Protein disorder:
DisMeta
Protein solubility:
camLILA
ccSOL
Camfold
camGroEL
Zyggregator
Isotope labeling:
UPLABEL
Solid-state NMR:
sedNMR


Reply
Thread Tools Search this Thread Rate Thread Display Modes
  #1  
Unread 08-21-2010, 09:12 PM
nmrlearner's Avatar
Senior Member
 
Join Date: Jan 2005
Posts: 23,184
Points: 193,617, Level: 100
Points: 193,617, Level: 100 Points: 193,617, Level: 100 Points: 193,617, Level: 100
Level up: 0%, 0 Points needed
Level up: 0% Level up: 0% Level up: 0%
Activity: 50.7%
Activity: 50.7% Activity: 50.7% Activity: 50.7%
Last Achievements
Award-Showcase
NMR Credits: 0
NMR Points: 193,617
Downloads: 0
Uploads: 0
Default Basics on Arrayed-NMR Data Analysis (Part IV)

Basics on Arrayed-NMR Data Analysis (Part IV)

Next up in my survey on analysis of arrayed NMR experiments ( View Parts 1, 2, 3 ) takes me to a quick overview of the different methods of data evaluation, such as the determination of peak heights and peak areas from arrayed experiments. Here you go...

Of the different existing methods for the extraction of peak intensities from arrayed NMR spectra (see [1] ), Mnova provides the following ones:

(1) Peak area integration

This is the default method in Mnova Data Analysis module (see figure below)


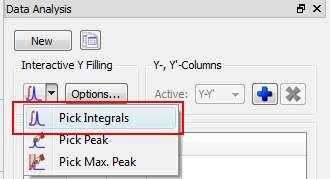
This method consists of a standard numeric integration over the whole peak. Basically, the program is summing up all the points within the selected area of interest) as illustrated in the figure below:

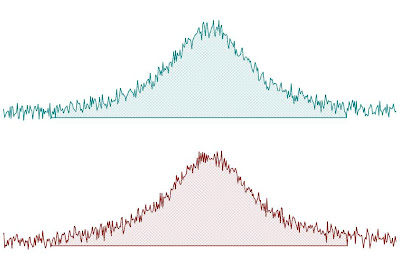
This figure has been created as follow: two identical Lorentzian lines (green & red) were simulated and then noise was added. The noise level is the same in both spectra but obviously, the actual numbers are different (more technically, noise in both spectra was calculated using a different seed in the random number generator).

This peak area method for data extraction is quite robust to noise (provided that the noise level is more or less constant across the different spectra in the arrayed experiment) and more importantly, insensitive to chemical shift fluctuations from trace to trace in the experiment, a situation which is more frequent than generally realized. For these reasons, and for its simplicity of use, this is method of choice for well-resolved peaks.

If the peaks of interest exhibit some degree of overlap, this method is not very reliable and some of the next methods will be more convenient

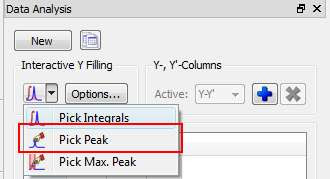
(2) Peak Height Measurement

This is the second method for data extraction (see figure below) and it finds the peak height at a given chemical shift across all the spectra in the arrayed experiment.


By default, the program will find the peak intensity at the position indicated by the user (using a vertical cursor) and then it will perform a parabolic interpolation in order to refine the value. In addition, the user can specify an interval in such a way that the program will find the maximum peak within that region. This can be done in 2 different ways:


  • i) If you click in the Options button, you can define whether you want to use Parabolic and the interval in which the maximum should be found (in ppm

  • (ii) Alternatively, once a peak has been selected, you can change the interval by direct editing of the peak selection model. In the figure below, I’m showing how the peak selection model is PeakIntensity. The first number (6.001 in the figure) corresponds to the central chemical shift whereas the second number (0.100 in the figure) represents the interval for the peak maximum search.


Parabolic interpolation is useful because it minimizes the problems caused by the random noise. For example, let’s assume that Parabolic interpolation is not used so that peak heights extraction will be done always at the same fixed chemical shift position (see figure below). As described in reference [1] and illustrated in the figure below, when this method is used the values are seen to be quite different in the two cases: here the precision of the measurement will depend strongly on the noise.

Parabolic interpolation and/or measurement of the intensity as the maximum height within a fixed box around the peak will help to minimize the effects of movements on the chemical shift position of the peaks due to, for example, temperature instability, pH changes, etc.

For convenience, Mnova includes the so-called Pick Max. Peak method which is totally equivalent to the previous one but it allows the graphical selection of the left and right boundaries in which the maximum peak will be searched for.

In a nutshell, peak height measurement can be used in those cases in which peak overlap might represent a problem. However, it should be noted that if for some reasons the line widths of the peaks under analysis change from trace to trace, peak heights will not represent a reliable measurement and peak integrals should be used instead.

In general, I would recommend peak integrals as the most general-purpose method for quantitation of peak intensities in arrayed experiments.

In the next post of these series I will address the problem of exponential fitting useful in relaxation and diffusion experiments.

References:

[1] Viles JH, Duggan BM, Zaborowski E, Schwarzinger S, Huntley JJA, Kroon GJA, Dyson HJ, Wright PE. 2001. Potential bias in NMR relaxation data introduced by peak intensity analysis and curve fitting methods. J Biomol NMR 21:1–9 (link)


More...

Source: NMR-analysis blog
Reply With Quote


Did you find this post helpful? Yes | No

Reply
Similar Threads
Thread Thread Starter Forum Replies Last Post
[Question from NMRWiki Q&A forum] exporting part of data to excel, origin
exporting part of data to excel, origin Hi,i'm new in TopSpin and i am blocked by a simple (i thinks) problem.I have a 1D specrtrum and i would like to export it to excel or origin but my spectrum have a small S/N so there is to much point --> i want this spectrum with less point but without smoothing (if it's possible).In other word, how can i do to tell TopSpin "get the spectrum but only every 10 points (or X points)" ? Thank you in advance for those who will have the kindness to answer. Check if somebody has answered this question on NMRWiki QA forum
nmrlearner News from other NMR forums 0 06-29-2011 04:51 PM
[NMR tweet] http://www.pulist.net/spin-dynamics-basics-of-nuclear-magnetic-resonance.html #quarks #and #nucleons #nuclear Spin Dynamics: Basics of N
http://www.pulist.net/spin-dynamics-basics-of-nuclear-magnetic-resonance.html #quarks #and #nucleons #nuclear Spin Dynamics: Basics of N Published by pubooks (Joel Michal) on 2011-03-31T07:54:11Z Source: Twitter
nmrlearner Twitter NMR 0 03-31-2011 08:09 AM
[NMR analysis blog] Binning and NMR Data Analysis
Binning and NMR Data Analysis Yesterday I mentioned that many NMR arrayed experiments suffer from unwanted chemical shift variations due to fluctuations in experimental conditions such as sample temperature, pH, ionic strength, etc. This phenomenon is very common in NMR spectra of e.g. biofluids (metabonomics/metabolomics) but also exists in many other experiments such us Relaxation, Kinetics and PFG NMR spectra (diffusion). This problem negatively affects the reliability of quantitation using, for instance, peak heights, and for this reason integration is, in general, a more robust...
nmrlearner News from NMR blogs 0 08-21-2010 09:12 PM
[NMR analysis blog] Basics on Arrayed-NMR Data Analysis (Part III): Extracting and calculating useful NMR
Basics on Arrayed-NMR Data Analysis (Part III): Extracting and calculating useful NMR related molecular information After the basic introductory posts on arrayed NMR experiments, it’s now time to get some action and see how to extract relevant information from these experiments and calculate useful NMR related parameters such as diffusion, relaxation times, kinetics constants, etc. Actually, in this post I will cover the first case, that is, the analysis of PFG experiments to calculate diffusion coefficients. The reason for this is twofold: (1) I have a nice PFG data set whilst the...
nmrlearner News from NMR blogs 0 08-21-2010 09:12 PM
[NMR analysis blog] Basics on Arrayed-NMR Data Analysis (Part II): Practical hints
Basics on Arrayed-NMR Data Analysis (Part II): Practical hints Further to my previous post, I will cover today some more basic tools available in Mnova for the analysis of NMR arrayed experiments. In particular, I will touch on the following points: How to use different display modes for 1D arrayed spectra How to navigate throughout the different subspectra in the arrayed item How to process individual spectra separately
nmrlearner News from NMR blogs 0 08-21-2010 09:12 PM
[NMR analysis blog] Basics on Arrayed-NMR Data Analysis (part I)
Basics on Arrayed-NMR Data Analysis (part I) In this post I will cover some basic concepts on the analysis of a very important class of NMR experiments, the so-called Arrayed NMR spectra. The concept is very simple: an arrayed experiment is basically a set of individual spectra acquired sequentially and related to each other through the variation of one or more parameters and finally grouped together to constitute a composite experiment. These experiments are also known as ‘pseudo-2D’. For example, in the case of Bruker spectra they have the same file name as 2D spectra, that is ser files...
nmrlearner News from NMR blogs 0 08-21-2010 09:12 PM
[NMR analysis blog] Mnova 6.0, at last! GSD, Line Fitting, Data Analysis, handling of LC/GC/MS data and m
Mnova 6.0, at last! GSD, Line Fitting, Data Analysis, handling of LC/GC/MS data and much more! It's been over 6 weeks since my last post on this blog but don’t worry, I haven’t been idle. On the contrary, I have a very good excuse for this lack of posts: We all at Mestrelab have been working very hard trying to get version 6.0 of Mnova finished. Now I’m delighted to announce that we have done it and version 6.0 is finally available for download from our Web site. This is certainly a major upgrade of the software in which we have put a lot of work and passion. It brings a number of...
nmrlearner News from NMR blogs 0 08-21-2010 09:12 PM
Biomolecular NMR Data Analysis
Biomolecular NMR Data Analysis Publication year: 2010 Source: Progress in Nuclear Magnetic Resonance Spectroscopy, In Press, Accepted Manuscript, Available online 2 March 2010</br> Michael R., Gryk , Jay, Vyas , Mark W., Maciejewski</br> More...
nmrlearner Journal club 0 08-16-2010 03:50 AM


Posting Rules
You may not post new threads
You may not post replies
You may not post attachments
You may not edit your posts

BB code is On
Smilies are On
[IMG] code is On
HTML code is Off
Trackbacks are Off
Pingbacks are Off
Refbacks are Off


BioNMR advertisements to pay for website hosting and domain registration. Nobody does it for us.


Powered by vBulletin® Version 3.7.3
Copyright ©2000 - 2024, Jelsoft Enterprises Ltd.
Copyright, BioNMR.com, 2003-2013
Search Engine Friendly URLs by vBSEO 3.6.0

All times are GMT. The time now is 03:52 AM.


Map