The limitations of 19F GARP Decoupling
In a
previous post, it was shown that distorted line shapes are obtained for resonances in broadband decoupled NMR spectra when the resonances of the decoupled nuclide are outside of the effective decoupling bandwidth. This can be a particularly difficult problem when observing 1H NMR spectra with 19F decoupling. 19F has a large chemicals shift range so, if there are multiple widely spaced 19F resonances, it will be difficult or impossible to decouple all 19F sites at once, particularly at higher magnetic field strengths. If one is not aware of this problem, data misinterpretation may be an issue as distorted line shapes will lead incorrect splittings used to measure coupling constants. The figure below illustrates this problem. The top three panels of the figure show the 300 MHz 1H[19F] NMR spectra for the three 1H resonances of 1,2-difluoropyridine as a function of the 19F decoupler offset. The GARP decoupling scheme was used with 90° pulses of 80 µsec. The decoupler offsets, depicted in the bottom panel of the figure, were varied in 5 ppm increments.
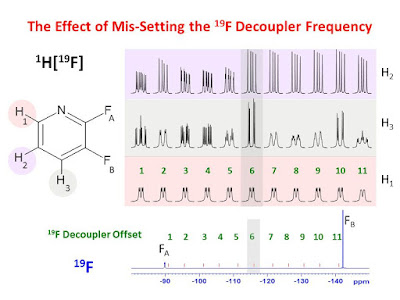
Of the 11 decoupler offsets used, only offset 6 (at -116 ppm) effectively decoupled both 19F sites. Varying the decoupler offset by only ± 5 ppm leads to distorted line shapes, which are particularly pronounced for the H3 resonance. These distorted line shapes could easily lead to data misinterpretation and erroneous coupling constants. In this case, the 19F decoupling bandwidth is 55 ppm. Since the chemical shift difference between the two 19F resonances is 52 ppm, one is able to obtain a fully 19F decoupled 1H spectrum with the careful choice of the decoupler offset frequency however, there will be cases where the decoupling bandwidth would not be sufficient to decouple all 19F resonances in some molecules. How then can one generally evaluate all of the coupling constants in fluorine containing molecules? The 19F-19F couplings can be evaluated in a 19F[1H] spectrum (not shown). Specific 1H-19F coupling constants can be determined by measuring
a 1H PSYCHE spectrum or be collecting 1H spectra with selective 19F continuous wave (CW) decoupling for each of the19F resonances. The latter is shown in the figure below. The bottom panel shows a standard 1H spectrum. The middle two panels show the 1H spectra for each of the 19F sites decoupled separately using CW decoupling. The top panel shows the fully 19F decoupled spectrum.
Using these data, all of the coupling constants can be evaluated and are shown in the figure below.
In conclusion, one must be careful in interpreting 1H[19F] spectra and understand the limits of the 19F decoupling scheme used.


Source:
University of Ottawa NMR Facility Blog