Cross Polarization Based Mixture Resolution in Solids
One of the most common techniques used to collect solid-state NMR data for spin
I = ½ nuclides is a combination of cross polarization (
CP) and magic angle spinning (
MAS). CPMAS provides
high sensitivity from the
CP and high chemical shift resolution from the
MAS. Furthermore, the scan repetition rate depends on the shorter relaxation time of the protons rather than the longer relaxation time of the spin
I = ½ nuclide therefore, more scans can be collected per unit time. It must be remembered however, that the success of the
CP technique depends on the dipolar coupling interaction between proximate protons and the nucleus being observed. In the absence of dipolar coupled protons,
CP signals are not observed. For this reason, it is sometimes necessary to use a conventional one-pulse method (Bloch decay) which can be used to observe the spin
I = ½ nuclide, albeit with lower sensitivity, whether protons are present or not. When a sample consists of a mixture with some protonated components and some components without protons, then it may be advantageous to collect both a CPMAS and a Block decay spectrum. When both methods are used, the data can be used to resolve the spectrum of the mixture into subspectra; the protonated components in one spectrum and those components without protons in another. An example of this is shown with the 13C NMR data for a common antacid tablet in the figure below.
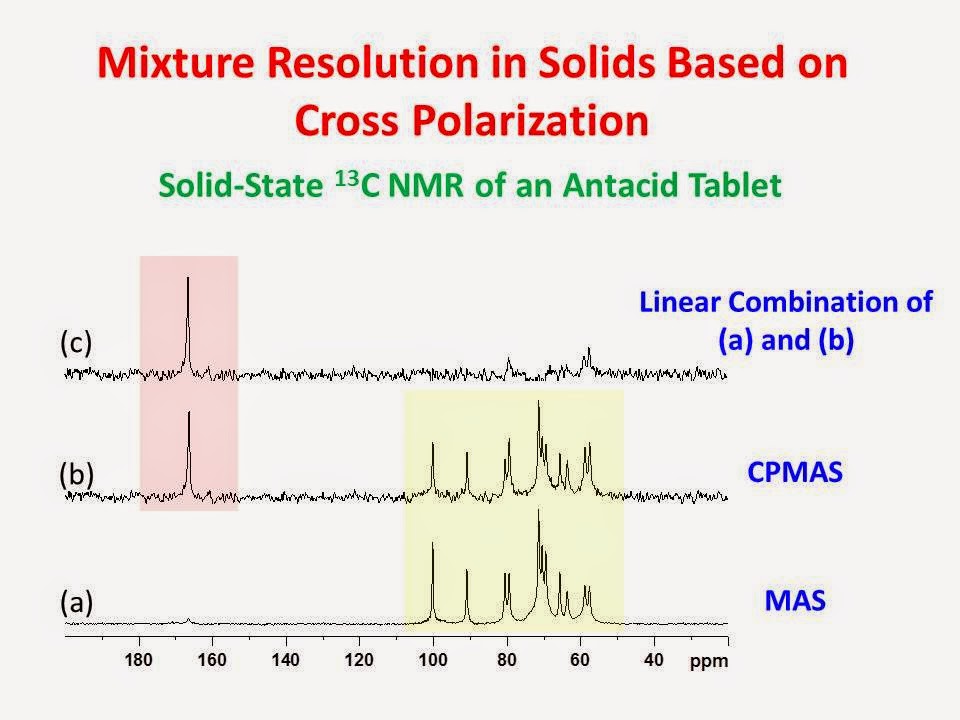
The two most abundant carbon containing components of an antacid tablet are calcium carbonate and sucrose. Spectrum (a) is the CPMAS spectrum. It consists only of the resonances of sucrose (color coded in yellow) since calcium carbonate (color coded in pink) contains no protons. Spectrum (b) is the Bloch decay spectrum with high power proton decoupling. It consists of both the resonances of sucrose and calcium carbonate. Spectrum (c) is a linear combination of (a) and (b) and represents, primarily, the spectrum of calcium carbonate. Another interesting example of CP based mixture analysis is given
here using fruitcake as an example.


Source:
University of Ottawa NMR Facility Blog